Kipp & Zonen receives a lot of questions about whether a particular data logger is suitable for use with our instruments. These are mainly from the solar energy sector, where users are less familiar with the signal output than in meteorology and climate research. Let me share my experiences on dataloggers to you.
I will concentrate on our CMP series pyranometers for measuring global and diffuse horizontal irradiance (GHI and DHI) and plane of array (POA) irradiance. However, similar considerations apply to the CHP1 pyrheliometer for measuring direct normal irradiance (DNI).
What comes out of a pyranometer detector?
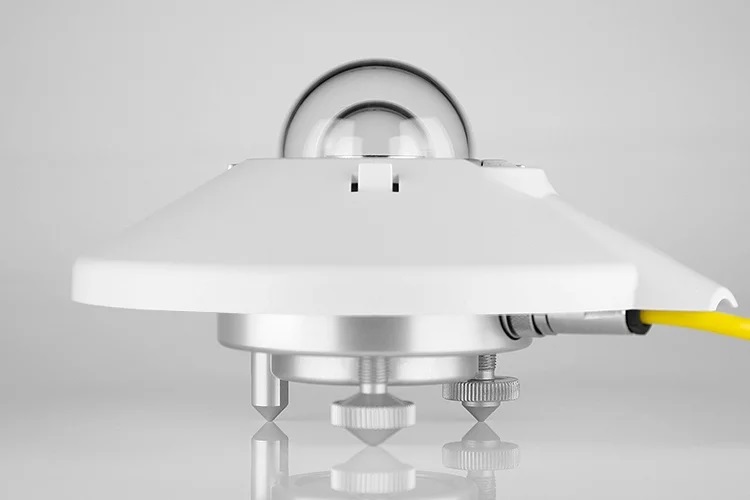
Let’s first start with what the output of our instruments. The detector of a thermopile pyranometer generates a small analog output voltage that is proportional to the solar irradiance falling on the black absorber surface. This is a continuous DC voltage, typically about 10 microvolts for each Watt per square metre of irradiance received.
Each pyranometer has a unique sensitivity, which is given on the calibration certificate in µV/W/m2 and is traceable to the World Radiometric Reference in Switzerland. There is no resolution limit other than random electron noise, which is less than 0.01 W/m2.
What do I get on a CMP series signal cable?
The ‘Classic’ CMP series models have no active electronics and do not require any power. The signal on the red and blue wires of the yellow cable is directly from the thermopile detector. The sensitivity changes when its temperature is different from the temperature on the calibration certificate (usually around +22°C), so all models except for the CMP3 and CMP6 have a temperature compensation circuit built-in that alters the load on the detector.
The amount of GHI reaching the earth’s surface at a given location and date depends upon the height of the sun in the sky (which affects the thickness of atmosphere that the light is passing through) and the sky conditions, particularly clouds. Typical values for around solar noon in mid-latitudes are shown below.
POA solar irradiance can be higher than GHI, but the maximum likely to occur under natural sunlight anywhere on earth is around 1500 W/m2. Depending upon the model, the pyranometer sensitivity could be as low as 5 µV/W/m2, or as high as 20. Therefore, the output signal should not exceed 30 millivolts (mV); but 1 W/m2 could be only 5 microvolts (µV).
The sensitivity on the calibration certificate and the CMP pyranometer label needs to be entered into a data logger or data processing system to convert the signal from mV to W/m2.
When correctly installed and maintained (dome clean!) an ISO 9060:1990 Secondary Standard pyranometer such as the CMP10, 11 or 21 can measure the daily total of irradiance with an uncertainty of around ± 2%, a CMP22 to about ± 1.2%, so it is important that the data logger does not degrade the measurements.
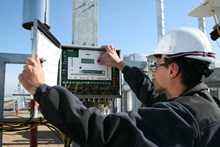
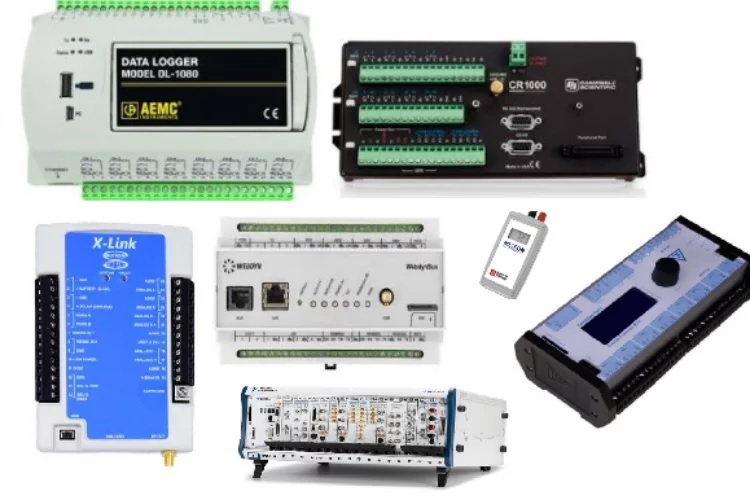
What type of data logger do I need?
There are a lot of data loggers out there and many scientific and meteorological types are suitable for accurately acquiring measurements from a CMP series pyranometer, but many ‘industrial’ models are not. Let s zoom in on some details of data loggers and find out why.
Ideally, we want to record changes in irradiance of 1 W/m2. On a bright sunny day GHI is about 1000 W/m2 and 1 W/m2 represents 0.1 %, but on a cloudy day GHI could be only 100 W/m2 and it then represents 1 %. We don’t want the data logger or voltage input module to affect this, so its performance should be significantly better.
The basic issue is the performance of the analog-to-digital converter (ADC) and the performance of the programmable amplifier before the ADC that is often used to change the input range and scaling. The ADC performance also depends on the accuracy and stability of the reference voltage used for the conversion.
Resolution
Every ADC has a theoretical resolution that is usually expressed as 10, 12, 16 or 24 bits. The logger or input module will also have a number of selectable DC voltage input ranges achieved with a variable gain amplifier; for scientific models this is often down to around 20 mV, but industrial models may only have 1 V, 5 V or 10 Volt ranges.
The critical issue is how many bits of conversion are available for a specific input voltage range. With this information we can determine if the data logger is suitable for a CMP series pyranometer. Let’s assume the pyranometer has a sensitivity of 10.5 µV/W/m², which means that the thermopile detector will generate 10.5 µV for each 1 W/m² solar radiation. Let us look at two different data loggers to determine which one suits the pyranometer best.
Data logger no.1 has a resolution of 10 bits and an analog input range of 5 VDC, whereas data logger no.2 has a resolution of 16 bits and an analog input range of 100 mVDC.
The voltage input range is divided into a number of steps based on its resolution. For no.1 this means that the 5 V range is divided into 1024 steps (10 bits = 210), for no.2 the 100mV range is divided into 65536 steps (16 bits = 216)
This means that the smallest detectable changes are:
For no. 1, 5 V/1024 steps = 0.00488 V (4.88 mV).
For no. 2, 0.1V/65536 steps = 0.00000152V (0.00152mV, or 1.52 µV).
What would happen if we connect our pyranometer with a sensitivity of 10.5 µV/W/m2 (which is 0.0105 mV)?
4.88 mV/ 0.0105mV = 465 W/m² before we see a change in the values recorded by the logger output
This means that every solar radiation level up to 464 W/m2 will be detected as 0 W/m2, between 465 and 929 will be recorded as 465 W/m2, and so on. It is obvious that data logger no. 1 is not suitable at all; it will only provide 2 different values between 0 W/m2 and 929 W/m2 of measured irradiance.
Data logger no.2 will be excellent; 0.00152mV/0.0105mV= 0.14 W/m², so we can see very small changes in irradiance recorded and it won’t degrade the pyranometer measurements.
16-bit resolution and a 20mV input would be even better, as would 24 bits and a 10 V range. However, the least significant bit (LSB) is often not reliable, due to noise and jitter and other effects, so the usable resolution may be double the figures given for the data logger examples above.
Zero offset
The analog input amplifier will have an electronic offset, whereby zero mV input is not recorded as zero, and this affects all the readings. Using a differential input mode, instead of single-ended (referred to the logger 0 V) reduces this offset and should always be used with CMP pyranometers. Check the logger specifications, the input offset should be less than the equivalent of 1 W/m².
Temperature
High quality data loggers have temperature correction for the input amplifiers and the ADC reference voltage. The performance specifications are valid over a wide temperature range, typically at least from -25°C to +50°C. This is important for data loggers used in locations without climate control. Industrial data loggers are often only specified for +20°C or +25°C and do not have information on how the performance degrades at other temperatures.
Noise
Solar energy PV plants can have strong 50 Hz or 60 Hz electrical fields from inverters and high voltage grid step-up transformers. This interference can be picked up on cables and on logger inputs, good grounding of the pyranometer cable shield is essential. The logger should have 50/60 Hz filters and in extreme cases it may be necessary to put it in a grounded metal enclosure.
Accuracy
There should be a specification for the overall ‘accuracy’ of the data logger or input module on each input range. This should include the effects of resolution, offsets, noise, linearity and temperature. High quality data loggers specify this as a percentage of the reading, but for industrial units it is often given as a percentage of the full input range. There is a big difference – beware!
We want the overall accuracy to be equivalent to 1 W/m² (10 µV), ideally better.
Sampling and logging
The signal from the CMP pyranometer should be logged at least every 3 seconds and the average stored every minute (IEC 61724-1, 2017). This smooths out noise and the effects of clouds. A single reading every 10 minutes might catch the only cloud in an otherwise clear sky, or the only clear patch in a cloudy sky, and the plant management software then applies that as the condition for the whole 10 minute period.
Averaging also minimises the effects of data loggers across a site not being well time-synchronised. In addition, recording every minute the minimum, maximum and standard deviation of the samples during the period allows for QA/QC of the 1 minute data so that unusual measurements (maybe due to maintenance on site) are not included in the performance ratio data.
LOGBOX SE, the Smart and convenient solution
The Kipp & Zonen LOGBOX SE is a light, compact and weatherproof data logger that works from -40°C to +60°C. It does not need any external power to operate and is ideal for connecting up to four Kipp & Zonen CMP series pyranometers.
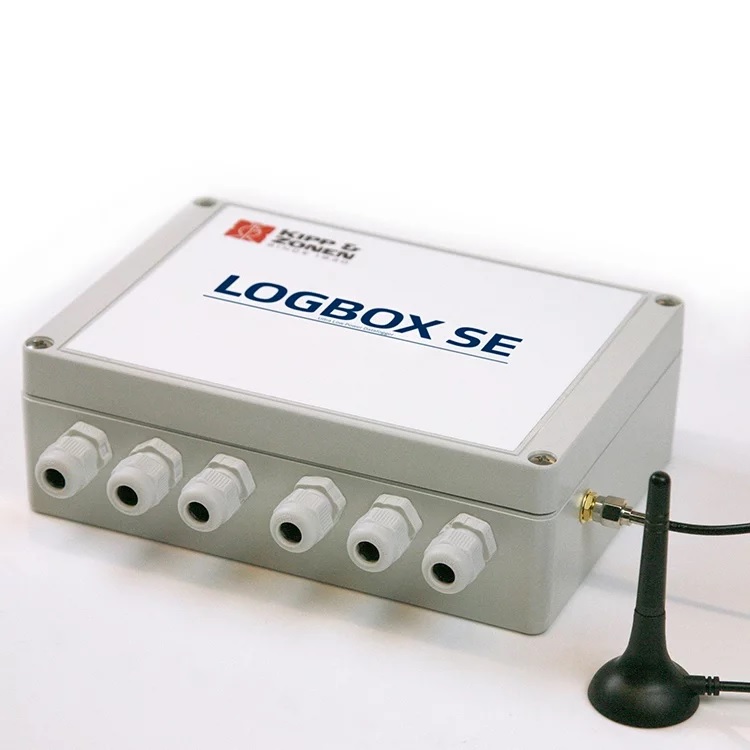
LOGBOX SE has 4 differential dc voltage inputs with 24-bit resolution, selectable input ranges from 19 mV to 2500 mV (2.5 V) and very good performance. Drop-down menus in the configuration software make it easy to enter the pyranometer sensitivity so that data is recorded in W/m².
There are also 4 single-ended 12-bit voltage inputs, 2 x 2.5 V and 2 x 3 V and it can record from 10K thermistor and Pt-100 temperatures sensors. 4 logic level inputs allow for pulse counting and frequency measurements.
LOGBOX SE can also log RS-485 Modbus® data from up to 8 ‘Smart’ SMP series pyranometers (or other Kipp & Zonen Smart devices). The sensitivity or conversion factor is stored in the Smart device memory so the correct units are already in the data message. Our Smart Hub and Smart Powered Hub are convenient ways to connect multiple Smart devices to the logger and power them all.
Sampling and logging can be selected at rates down to 1 second. If the logging interval is longer than sampling rate the average, minimum, maximum and standard deviation can be recorded. A 512mB industrial grade SD card is supplied for storing months of data and there is an internal quad-band GSM / GPRS modem with external antenna for wireless data transfer to an e-mail address or ftp server and for time synchronisation.
LOGBOX SE runs for a month on six internal AA batteries, depending upon the modem usage, and also has connections for external DC power supplies or a PV panel.
Request your quote or, even better, order it now!
Written by Michael van Alebeek, Sales & Service Engineer Kipp & Zonen