The key components of the system include a 1 kW sourcemeter performing IV (current/voltage) sweeps, a switching mainframe that directs the system to select a PV module to test while routing the other modules to fixed load resistors while not under test. A data acquisition system collects readings from weather-station instruments tracking irradiance, temperature (both back-of-module and ambient) and wind speed.
Current, voltage and power observations, correlated to our weather-station device readings, are collected from a total of 20 c-Si (crystalline silicon), a-Si (amorphous silicon) and CIGS (copper indium gallium (di)selenide) PV modules every ten minutes during daylight-hours when plane of array irradiance is > 20 W/m². To measure POA IRR, we use several Kipp & Zonen SP Lite2 photodiode detector pyranometers.
Secondary-standard, first-class and second class thermopiletype pyranometers measure all the available solar irradiance throughout the range 300 to 2800 nm, which more than covers the wavelengths to which PV technologies respond. However, silicon diode pyranometers only respond to a narrower range of wavelengths (400 to 1100 nm) but are still used in PV weather stations, in part because they are less expensive than thermopiles. Therefore, in March 2011, we added a secondary standard Kipp & Zonen CMP 21 to our test-bed.
Based on observations taken between July and December 2010, our PV module performance results consist of a series of graphs plotting percentage Pmax, Isc, Voc and FF against POA irradiance, as well as percentage Pmax against AOI, percentage Pmax and FF against module temperature, and FF and percentage Pmax over time intervals. Shown on the graph is the percentage of Pmax under Standard Test Conditions (STC, 1000 W/m² and +25 °C) that is actually produced under real world outdoor conditions.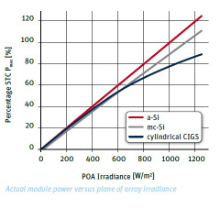
In accordance with IEC 61853-1, we also calculated linear and polynomial line fits for percentage Pmax versus irradiance and linear interpolations of Isc, Voc, Vmp and Pmax with respect to temperature and irradiance as well as a polynomial interpolation of Pmax to irradiance.
We observed that our CIGS module had a better fit with a polynomial rather than a linear equation, especially below 1000W/m². As indicated in the graph a-Si module clearly demonstrates a better power index to irradiance performance ratio than either c-Si or CIGS. This corresponds to the equations in the table and is due to a-Si’s superior temperature coefficient.
Outdoor PV module testing systems, such as the one we developed can dramatically increase an organization’s capability to evaluate PV under real-world conditions. They help to highlight the limitations of STC-based PV ratings and can assist a PV manufacturer with product development or a developer with selecting PV modules for installation.
Source: Buday, M., Keoleian, G., Marion, W., Measuring Irradiance, Temperature and Angle of Incidence Effects on Photovoltaic Modules in Auburn Hills, Michigan, Center for Sustainable Systems, Report No. CSS11-12, University of Michigan, Ann Arbor, Michigan.