The station is equipped with a 35 m high tower, heavily instrumented with sensors, probes and devices that put the forest under a microscope. The top of the tower is about 5-6 meters higher than the tallest trees. Several parameters of micro-meteorology are monitored above the canopy, including; air temperature and relative humidity, rain, dew point, air pressure, wind speed and wind direction.
In a vertical profile up the tower air temperature, humidity, wind speed and direction are measured at six heights and air gas concentrations (CO2, H2O, O3) are sampled at eight heights.
Below the canopy, at ground level or underground, variables of soil micrometeorology such as soil temperature, soil water content, soil heat flux (G), soil CO2 efflux (i.e. soil respiration), tree trunk growth and sap flow rates are measured. More details of the station and the instrumentation, including real-time data, can be found at www.barbeau.u-psud.fr .
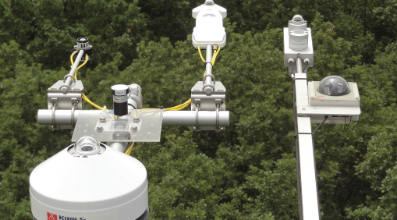
 Solar radiation sensors at the top of the tower
Data collected from monitoring allow us to interpret and explain the fluxes of energy and mass between the forest and the atmosphere. Using the ‘Eddy Covariance’ approach, the measurement of fluxes of matter and energy consists of using a combination of two instruments, a three-dimensional sonic anemometer and a fast CO2/H2O analyzer. Monitored with a scanning frequency of at least 10Hz, the vertical component of the wind speed is taken into account in co-variance with the monitored variables (CO2, H2O or air temperature). This enables calculation of the vertical CO2 and H2O turbulent flux (mass) and the vertical heat (H) and latent heat flux (LE) (energy) between forest and atmosphere.
In addition to the air variables described above, there are several solar radiation sensors installed above and below the Barbeau forest canopy. Light is indeed a very important parameter to take into account in plant functioning as it takes part directly in the leaf photosynthesis mechanism.
Thus, global radiation (Rg, Kipp & Zonen CMP22) and net radiation (Rnet, Kipp & Zonen CNR 4) ventilated sensors were installed at the top of the tower to know what is the part of energy coming from the sky, the part that is reflected by the vegetation (trees and soil) and therefore the part that is absorbed.
A difficult issue with the Eddy Covariance method remains to quantify estimates of the uncertainty of the reported flux values. These fluxes are in fact complex processes, and the estimates result from various measurements and calculations as well as numerous explicit and implicit assumptions. Hence, documenting the absolute accuracy of these values is somewhat problematic. However, one simple measure of internal consistency is to check for conservation of energy.
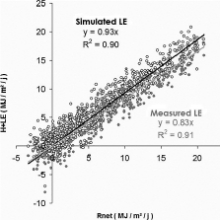
The sum of the turbulence fluxes of sensible and latent heat should balance the available energy: Rnet = H + LE + G where Rnet is the net radiation, H the sensible heat flux, LE the latent heat flux and G the soil heat flux.

Shown is a typical relationship for a forest, using data from Tharandt forest station, Germany in 2006 and 2007 and adapted from N. Delpierre, 2009.
In addition, two Kipp & Zonen PQS1 PAR (photosynthetically active radiation) sensors were installed back-to-back at the top of the tower to monitor the incoming PAR from the sky and the reflected PAR from the vegetation. Below the canopy, fifteen PQS1 PAR sensors were distributed on the ground to measure the amount of the PAR reaching the soil. Hence, we can calculate the PAR fraction absorbed by the forest.
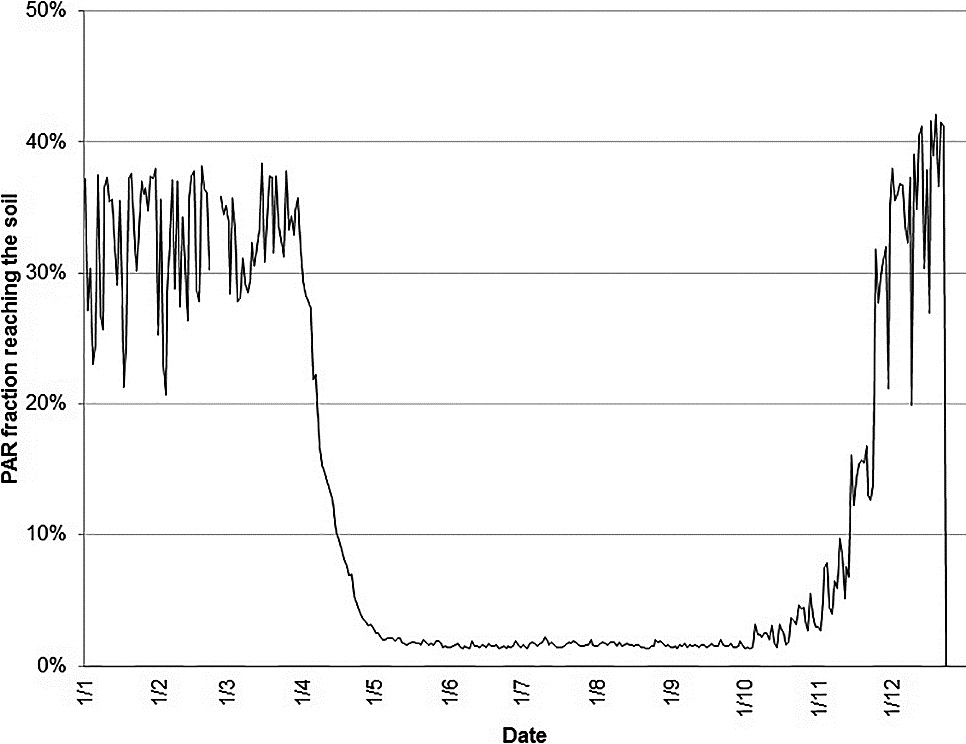
Barbeau is a deciduous broadleaf oak forest, so the leaves fall in autumn. In winter, the PAR fraction that reaches the soil corresponds to 35% of incoming PAR and in summer, only 1 to 2% reaches the soil, as shown in the graph. The PAR is intercepted by wood in winter (trunks, branches and twigs) and mainly by leaves in summer.

This interception can be directly correlated to the leaf area index (LAI, in m2 of leaves per m2 of soil) indicative of the forest density. The more leaves there are, the less light is reaching the soil.
All sensors are controlled, and data collected, by ten Campbell Scientific dataloggers (CR1000 & CR3000) connected through an Ethernet network. Data are uploaded to the laboratory servers through a satellite connection and displayed half-hourly on the Barbeau station website at www.barbeau.u-psud.fr/realtime.html
Article by Daniel Berveiller, Research Engineer, CNRS, France
Reference:
Delpierre, N. (2009) - Unravelling the determinism of interannual variations of carbon exchanges between European forests and the atmosphere: a process-based modelling approach. With this PhD thesis he obtained the degree of Doctor of Science from the University of Paris XI Orsay.
http://max2.ese.u-psud.fr/publications/THESE_Delpierre.pdf